Reshaping data with tidyr, part 2

Practical Computing and Data Science Tools

Annoucements

  • Midterm II is Thursday, November 14th.
  • Material on the midterm will include all material through Week 11.

Agenda

  • Reshaping data with tidyr
    • pivot_longer() and pivot_wider()
    • unite()
    • separate_wider_delim()
    • complete()
  • Application: stand and stock tables

Reshaping Data

The tidyr package

  • The tidyr package allows us to transform data from long to wide formats, and back.
  • A key use of the tidyr package is getting data in tidy format.
  • But what is tidy format?

Tidy data

“Tidy data” or “tidy format” is a formal concept of how we organize data for analyses, in particular, with tidy data:

  • Each row of the data correspond to a single observation, and
  • Each column of the data correspond to a variable.

Tidying data with tidyr

Consider the face dataset from IFDAR:

library(tidyverse)
face <- read_csv("../labs/datasets/FACE/FACE_aspen_core_growth.csv") %>%
  select(Rep, Treat, Clone, ID = `ID #`,
        contains(as.character(2001:2005)) & contains("Height"))
face
# A tibble: 1,991 × 9
     Rep Treat Clone    ID `2001_Height` `2002_Height` `2003_Height`
   <dbl> <dbl> <dbl> <dbl>         <dbl>         <dbl>         <dbl>
 1     1     1     8    45            NA            NA            NA
 2     1     1   216    44           547           622           715
 3     1     1     8    43           273           275           305
 4     1     1   216    42           526           619           720
 5     1     1   216    54           328           341           364
 6     1     1   271    55           543           590           634
 7     1     1   271    56           450           502           587
 8     1     1     8    57           217           227           256
 9     1     1   259    58           158           155            NA
10     1     1   271    59           230           241           260
# ℹ 1,981 more rows
# ℹ 2 more variables: `2004_Height` <dbl>, `2005_Height` <dbl>
Why the long face?

face_long <- face %>%
  pivot_longer(
    cols = c("2001_Height", "2002_Height", "2003_Height", 
             "2004_Height", "2005_Height"),
    names_to = "Year_Type",
    values_to = "Height_cm")

Why the long face?

face_long <- face %>%
  pivot_longer(
    cols = c("2001_Height", "2002_Height", "2003_Height", 
             "2004_Height", "2005_Height"),
    names_to = "Year_Type",
    values_to = "Height_cm")

Why the long face?

face_long <- face %>%
  pivot_longer(
    cols = contains("Height"),
    names_to = "Year_Type",
    values_to = "Height_cm")
  • A cleaner way to select these columns is to use dplyr’s contains() function.

Why the long face?

face_long
# A tibble: 9,955 × 6
     Rep Treat Clone    ID Year_Type   Height_cm
   <dbl> <dbl> <dbl> <dbl> <chr>           <dbl>
 1     1     1     8    45 2001_Height        NA
 2     1     1     8    45 2002_Height        NA
 3     1     1     8    45 2003_Height        NA
 4     1     1     8    45 2004_Height        NA
 5     1     1     8    45 2005_Height        NA
 6     1     1   216    44 2001_Height       547
 7     1     1   216    44 2002_Height       622
 8     1     1   216    44 2003_Height       715
 9     1     1   216    44 2004_Height       716
10     1     1   216    44 2005_Height       817
# ℹ 9,945 more rows
  • To get tidy data!

Going (back) to wide data

  • Sometimes, we need to “widen” a dataset to get it into tidy format.
  • For this example, we will just widen the face_long dataset back to its original form.
  • tidyr has an aptly named function, pivot_wider().
  • Key arguments of pivot_wider():
    • .data: the tibble to widen,
    • names_from: the column that contains values which will be assigned as the new column names,
    • values_from: the column that contains values which will be assigned as the new column values.

Pivoting wider

face_wide <- face_long %>%
  pivot_wider(names_from = "Year_Type", values_from = "Height_cm")

all_equal(face, face_wide)
[1] TRUE
  • This results in the same tibble that we started with!

Other useful tidyr functions

  • unite() for pasteing column values together with specified seperators,
  • The separate_wider_*() family: for splitting columns into multiple new columns:
    • separate_wider_delim(): separate by delimiter
    • separate_wider_position(): separate by position
    • separate_wider_regex(): separate by regular expression

unite(): examples

face_long
# A tibble: 9,955 × 6
     Rep Treat Clone    ID Year_Type   Height_cm
   <dbl> <dbl> <dbl> <dbl> <chr>           <dbl>
 1     1     1     8    45 2001_Height        NA
 2     1     1     8    45 2002_Height        NA
 3     1     1     8    45 2003_Height        NA
 4     1     1     8    45 2004_Height        NA
 5     1     1     8    45 2005_Height        NA
 6     1     1   216    44 2001_Height       547
 7     1     1   216    44 2002_Height       622
 8     1     1   216    44 2003_Height       715
 9     1     1   216    44 2004_Height       716
10     1     1   216    44 2005_Height       817
# ℹ 9,945 more rows

unite(): examples

face_long %>%
  unite(col = "Design", Rep, Treat, Clone, sep = "_")
# A tibble: 9,955 × 4
   Design     ID Year_Type   Height_cm
   <chr>   <dbl> <chr>           <dbl>
 1 1_1_8      45 2001_Height        NA
 2 1_1_8      45 2002_Height        NA
 3 1_1_8      45 2003_Height        NA
 4 1_1_8      45 2004_Height        NA
 5 1_1_8      45 2005_Height        NA
 6 1_1_216    44 2001_Height       547
 7 1_1_216    44 2002_Height       622
 8 1_1_216    44 2003_Height       715
 9 1_1_216    44 2004_Height       716
10 1_1_216    44 2005_Height       817
# ℹ 9,945 more rows

unite(): examples

face_long %>%
  unite(col = "Design", Rep, Treat, Clone, sep = ".")
# A tibble: 9,955 × 4
   Design     ID Year_Type   Height_cm
   <chr>   <dbl> <chr>           <dbl>
 1 1.1.8      45 2001_Height        NA
 2 1.1.8      45 2002_Height        NA
 3 1.1.8      45 2003_Height        NA
 4 1.1.8      45 2004_Height        NA
 5 1.1.8      45 2005_Height        NA
 6 1.1.216    44 2001_Height       547
 7 1.1.216    44 2002_Height       622
 8 1.1.216    44 2003_Height       715
 9 1.1.216    44 2004_Height       716
10 1.1.216    44 2005_Height       817
# ℹ 9,945 more rows

unite(): examples

face_long_abc <- face_long %>%
  unite(col = "Design", Rep, Treat, Clone, sep = "abc")
face_long_abc
# A tibble: 9,955 × 4
   Design         ID Year_Type   Height_cm
   <chr>       <dbl> <chr>           <dbl>
 1 1abc1abc8      45 2001_Height        NA
 2 1abc1abc8      45 2002_Height        NA
 3 1abc1abc8      45 2003_Height        NA
 4 1abc1abc8      45 2004_Height        NA
 5 1abc1abc8      45 2005_Height        NA
 6 1abc1abc216    44 2001_Height       547
 7 1abc1abc216    44 2002_Height       622
 8 1abc1abc216    44 2003_Height       715
 9 1abc1abc216    44 2004_Height       716
10 1abc1abc216    44 2005_Height       817
# ℹ 9,945 more rows

separate_wider_delim() examples

face_long_abc %>%
  separate_wider_delim(cols = "Design", 
                       delim = "abc",
                       names = c("Rep", "Treat", "Clone"))
# A tibble: 9,955 × 6
   Rep   Treat Clone    ID Year_Type   Height_cm
   <chr> <chr> <chr> <dbl> <chr>           <dbl>
 1 1     1     8        45 2001_Height        NA
 2 1     1     8        45 2002_Height        NA
 3 1     1     8        45 2003_Height        NA
 4 1     1     8        45 2004_Height        NA
 5 1     1     8        45 2005_Height        NA
 6 1     1     216      44 2001_Height       547
 7 1     1     216      44 2002_Height       622
 8 1     1     216      44 2003_Height       715
 9 1     1     216      44 2004_Height       716
10 1     1     216      44 2005_Height       817
# ℹ 9,945 more rows

separate_wider_delim() examples

face_long
# A tibble: 9,955 × 6
     Rep Treat Clone    ID Year_Type   Height_cm
   <dbl> <dbl> <dbl> <dbl> <chr>           <dbl>
 1     1     1     8    45 2001_Height        NA
 2     1     1     8    45 2002_Height        NA
 3     1     1     8    45 2003_Height        NA
 4     1     1     8    45 2004_Height        NA
 5     1     1     8    45 2005_Height        NA
 6     1     1   216    44 2001_Height       547
 7     1     1   216    44 2002_Height       622
 8     1     1   216    44 2003_Height       715
 9     1     1   216    44 2004_Height       716
10     1     1   216    44 2005_Height       817
# ℹ 9,945 more rows
face_long %>%
  separate_wider_delim(cols = "Year_Type", 
                       delim = "_",
                       names = c("Year", NA))
# A tibble: 9,955 × 6
     Rep Treat Clone    ID Year  Height_cm
   <dbl> <dbl> <dbl> <dbl> <chr>     <dbl>
 1     1     1     8    45 2001         NA
 2     1     1     8    45 2002         NA
 3     1     1     8    45 2003         NA
 4     1     1     8    45 2004         NA
 5     1     1     8    45 2005         NA
 6     1     1   216    44 2001        547
 7     1     1   216    44 2002        622
 8     1     1   216    44 2003        715
 9     1     1   216    44 2004        716
10     1     1   216    44 2005        817
# ℹ 9,945 more rows

The complete() function

The complete() function is used for filling in values that are not explicitly in the dataset. Let’s consider some toy data for an example:

trees <- tibble(
  plot = c(1,1,1,2,2,2,3,3),
  species = c("douglas-fir", "western red-cedar", "pacific madrone",
              "douglas-fir", "douglas-fir", "douglas-fir",
              "douglas-fir", "western red-cedar"),
  dbh = c(10, 12, 6, 13, 10, 8, 9, 14)
)
trees
# A tibble: 8 × 3
   plot species             dbh
  <dbl> <chr>             <dbl>
1     1 douglas-fir          10
2     1 western red-cedar    12
3     1 pacific madrone       6
4     2 douglas-fir          13
5     2 douglas-fir          10
6     2 douglas-fir           8
7     3 douglas-fir           9
8     3 western red-cedar    14

Compute total DBH by species and plot

trees %>%
  group_by(plot, species) %>%
  summarize(total_DBH = sum(dbh))
# A tibble: 6 × 3
# Groups:   plot [3]
   plot species           total_DBH
  <dbl> <chr>                 <dbl>
1     1 douglas-fir              10
2     1 pacific madrone           6
3     1 western red-cedar        12
4     2 douglas-fir              31
5     3 douglas-fir               9
6     3 western red-cedar        14
  • What’s the problem here?
  • Every possible species-plot observation doesn’t exist!
  • example: what should total DBH of western red-cedars be on plot 2?

We have to complete() the dataset!

trees %>%
  complete(plot, species) 
# A tibble: 11 × 3
    plot species             dbh
   <dbl> <chr>             <dbl>
 1     1 douglas-fir          10
 2     1 pacific madrone       6
 3     1 western red-cedar    12
 4     2 douglas-fir          13
 5     2 douglas-fir          10
 6     2 douglas-fir           8
 7     2 pacific madrone      NA
 8     2 western red-cedar    NA
 9     3 douglas-fir           9
10     3 pacific madrone      NA
11     3 western red-cedar    14
  • Now there is a row for every species-plot combination,
  • But by default, complete() filled the values as NA.
  • We can change that!

We have to complete() the dataset!

trees %>%
  complete(plot, species,
           fill = list(dbh = 0))
# A tibble: 11 × 3
    plot species             dbh
   <dbl> <chr>             <dbl>
 1     1 douglas-fir          10
 2     1 pacific madrone       6
 3     1 western red-cedar    12
 4     2 douglas-fir          13
 5     2 douglas-fir          10
 6     2 douglas-fir           8
 7     2 pacific madrone       0
 8     2 western red-cedar     0
 9     3 douglas-fir           9
10     3 pacific madrone       0
11     3 western red-cedar    14

Now we can compute totals for each combination!

trees %>%
  complete(plot, species,
           fill = list(dbh = 0)) %>%
  group_by(plot, species) %>%
  summarize(total_DBH = sum(dbh))
# A tibble: 9 × 3
# Groups:   plot [3]
   plot species           total_DBH
  <dbl> <chr>                 <dbl>
1     1 douglas-fir              10
2     1 pacific madrone           6
3     1 western red-cedar        12
4     2 douglas-fir              31
5     2 pacific madrone           0
6     2 western red-cedar         0
7     3 douglas-fir               9
8     3 pacific madrone           0
9     3 western red-cedar        14

Application: stand and stock tables

Stand and Stock tables

Stand tables:

  • Summarize a quantitative discrete variable (e.g., stem count)
  • Summaries are shown grouped by one or more categorical variable (e.g., size class or species).

Stock tables:

  • Summarizes a quantitative continuous variable (e.g., volume, weight, or basal area)
  • Summaries are shown grouped by one or more categorical variable (e.g., size class or species).

Common Stand/Stock tables in forestry

In forestry applications, stand and stock tables are most often grouped by DBH class and species.

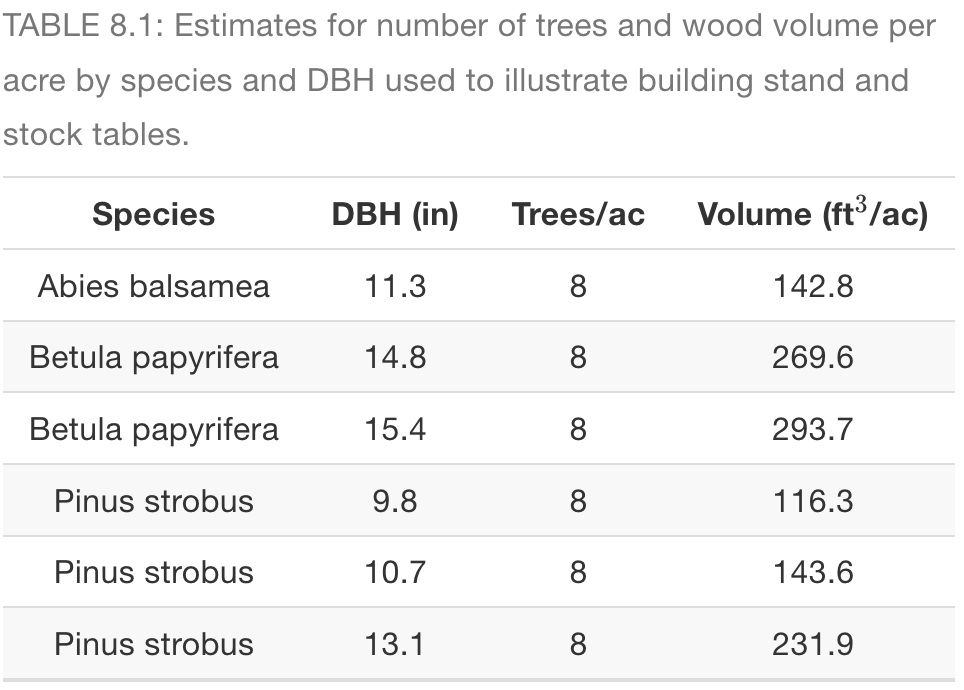
Data used to create stand and stock tables in forestry

In forestry applications, stand and stock tables are most often grouped by DBH class and species.

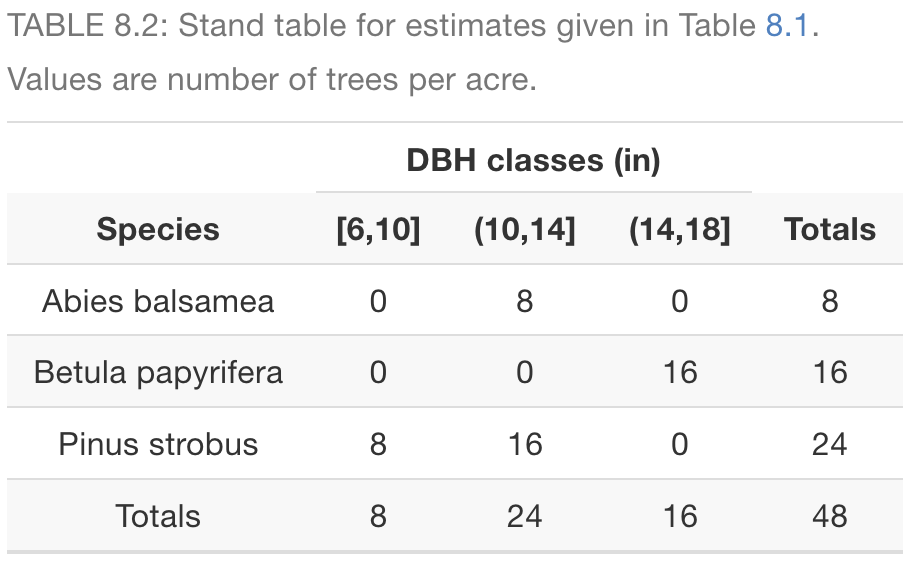
Stand table derived from the data

In forestry applications, stand and stock tables are most often grouped by DBH class and species.

  • Is this table tidy?

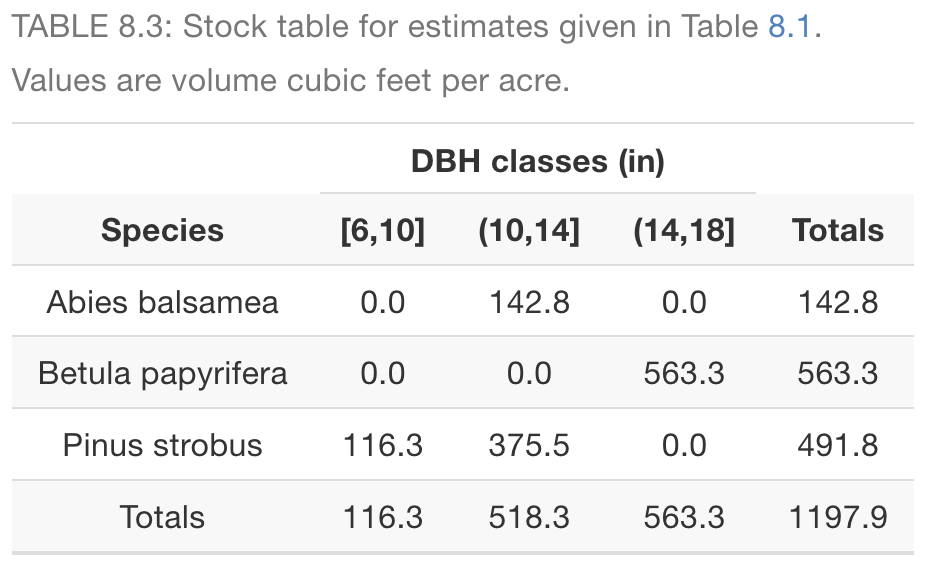
Stock table derived from the data

In forestry applications, stand and stock tables are most often grouped by DBH class and species.

  • Is this table tidy?

Building these stand and stock tables in R

We load the data:

trees <- tibble(
  species = c("Abies balsamea", "Betula papyrifera", 
              "Betula papyrifera", "Pinus strobus",
              "Pinus strobus", "Pinus strobus"),
  DBH_in = c(11.3, 14.8, 15.4, 9.8, 10.7, 13.1),
  trees_ac = 8,
  vol_cu_ft_ac = c(142.8, 269.6, 293.7, 116.3, 143.6, 231.9)
)
trees
# A tibble: 6 × 4
  species           DBH_in trees_ac vol_cu_ft_ac
  <chr>              <dbl>    <dbl>        <dbl>
1 Abies balsamea      11.3        8         143.
2 Betula papyrifera   14.8        8         270.
3 Betula papyrifera   15.4        8         294.
4 Pinus strobus        9.8        8         116.
5 Pinus strobus       10.7        8         144.
6 Pinus strobus       13.1        8         232.

Adding DBH class

ests <- trees %>%
  mutate(DBH_class = cut_width(DBH_in, width = 4))
ests
# A tibble: 6 × 5
  species           DBH_in trees_ac vol_cu_ft_ac DBH_class
  <chr>              <dbl>    <dbl>        <dbl> <fct>    
1 Abies balsamea      11.3        8         143. (10,14]  
2 Betula papyrifera   14.8        8         270. (14,18]  
3 Betula papyrifera   15.4        8         294. (14,18]  
4 Pinus strobus        9.8        8         116. [6,10]   
5 Pinus strobus       10.7        8         144. (10,14]  
6 Pinus strobus       13.1        8         232. (10,14]  

complete() the data

ests <- ests %>%
  complete(species, DBH_class, 
           fill = list(trees_ac = 0, vol_cu_ft_ac = 0))
ests
# A tibble: 11 × 5
   species           DBH_class DBH_in trees_ac vol_cu_ft_ac
   <chr>             <fct>      <dbl>    <dbl>        <dbl>
 1 Abies balsamea    [6,10]      NA          0           0 
 2 Abies balsamea    (10,14]     11.3        8         143.
 3 Abies balsamea    (14,18]     NA          0           0 
 4 Betula papyrifera [6,10]      NA          0           0 
 5 Betula papyrifera (10,14]     NA          0           0 
 6 Betula papyrifera (14,18]     14.8        8         270.
 7 Betula papyrifera (14,18]     15.4        8         294.
 8 Pinus strobus     [6,10]       9.8        8         116.
 9 Pinus strobus     (10,14]     10.7        8         144.
10 Pinus strobus     (10,14]     13.1        8         232.
11 Pinus strobus     (14,18]     NA          0           0 
  • What happened here?
  • Now each species/DBH_class combination has a row associated with it

Compute our variables of interest

ests <- ests %>% 
  group_by(species, DBH_class) %>%
  summarize(sum_trees_ac = sum(trees_ac),
            sum_vol_cu_ft_ac = sum(vol_cu_ft_ac))
ests
# A tibble: 9 × 4
# Groups:   species [3]
  species           DBH_class sum_trees_ac sum_vol_cu_ft_ac
  <chr>             <fct>            <dbl>            <dbl>
1 Abies balsamea    [6,10]               0               0 
2 Abies balsamea    (10,14]              8             143.
3 Abies balsamea    (14,18]              0               0 
4 Betula papyrifera [6,10]               0               0 
5 Betula papyrifera (10,14]              0               0 
6 Betula papyrifera (14,18]             16             563.
7 Pinus strobus     [6,10]               8             116.
8 Pinus strobus     (10,14]             16             376.
9 Pinus strobus     (14,18]              0               0 

Make the stand table

stand <- ests %>% 
  pivot_wider(id_cols = species, 
              names_from = DBH_class,
              values_from = sum_trees_ac)

stand
# A tibble: 3 × 4
# Groups:   species [3]
  species           `[6,10]` `(10,14]` `(14,18]`
  <chr>                <dbl>     <dbl>     <dbl>
1 Abies balsamea           0         8         0
2 Betula papyrifera        0         0        16
3 Pinus strobus            8        16         0

Make the stock table

stock <- ests %>% 
  pivot_wider(id_cols = species, 
              names_from = DBH_class,
              values_from = sum_vol_cu_ft_ac)

stock
# A tibble: 3 × 4
# Groups:   species [3]
  species           `[6,10]` `(10,14]` `(14,18]`
  <chr>                <dbl>     <dbl>     <dbl>
1 Abies balsamea          0       143.        0 
2 Betula papyrifera       0         0       563.
3 Pinus strobus         116.      376.        0 

All at once: stand table

trees %>%
  mutate(DBH_class = cut_width(DBH_in, width = 4)) %>%
  complete(species, DBH_class, 
           fill = list(trees_ac = 0, vol_cu_ft_ac = 0)) %>%
  group_by(species, DBH_class) %>%
  summarize(sum_trees_ac = sum(trees_ac),
            sum_vol_cu_ft_ac = sum(vol_cu_ft_ac)) %>%
  pivot_wider(id_cols = species, 
              names_from = DBH_class,
              values_from = sum_trees_ac)
# A tibble: 3 × 4
# Groups:   species [3]
  species           `[6,10]` `(10,14]` `(14,18]`
  <chr>                <dbl>     <dbl>     <dbl>
1 Abies balsamea           0         8         0
2 Betula papyrifera        0         0        16
3 Pinus strobus            8        16         0

All at once: stock table

trees %>%
  mutate(DBH_class = cut_width(DBH_in, width = 4)) %>%
  complete(species, DBH_class, 
           fill = list(trees_ac = 0, vol_cu_ft_ac = 0)) %>%
  group_by(species, DBH_class) %>%
  summarize(sum_trees_ac = sum(trees_ac),
            sum_vol_cu_ft_ac = sum(vol_cu_ft_ac)) %>%
  pivot_wider(id_cols = species, 
              names_from = DBH_class,
              values_from = sum_vol_cu_ft_ac)
# A tibble: 3 × 4
# Groups:   species [3]
  species           `[6,10]` `(10,14]` `(14,18]`
  <chr>                <dbl>     <dbl>     <dbl>
1 Abies balsamea          0       143.        0 
2 Betula papyrifera       0         0       563.
3 Pinus strobus         116.      376.        0 

Next time

  • The grammar of graphics