More graphics with ggplot2

Practical Computing and Data Science Tools

Agenda

  • Review final project
  • Review midterm parameters
  • Quiz
  • Building graphics incrementally
  • Arranging graphics
  • Saving graphics
  • Further discussion of final project + midterm exam + lab 11

Final project

  • Final presentations will occur during our final exam time slot: Thursday December 12th from 10am - 12pm, in NR223 (lab room).
  • Some potential datasets for the final project have been added to the course website.
  • Groups have been assigned and emailed to you all.
  • Next deadline: the proposal. Saturday, Nov 23rd at 5pm.

Midterm II

  • Will be taken in one week, Nov 23rd, during lab time.
  • Closed book, closed notes.
  • Handwritten “cheat sheet” allowed, just like Midterm I
  • Same format as Midterm I: 5 questions, top 4 are graded.

Quiz

Building graphics incrementally, combining plots with patchwork, and saving plots

Data

Today, we’ll use some data from pdxTrees:

library(tidyverse)
library(pdxTrees)
dat <- get_pdxTrees_parks(park = c("Woodstock Park")) %>%
  filter(Common_Name %in% c("Douglas-Fir", 
                            "Japanese Flowering Cherry",
                            "Western Redcedar"))
dat
# A tibble: 97 × 34
   Longitude Latitude UserID Genus      Family   DBH Inventory_Date      Species
       <dbl>    <dbl> <chr>  <chr>      <chr>  <dbl> <dttm>              <chr>  
 1     -123.     45.5 18381  Pseudotsu… Pinac…  41.3 2019-07-20 00:00:00 PSME   
 2     -123.     45.5 18386  Pseudotsu… Pinac…  34.7 2019-07-20 00:00:00 PSME   
 3     -123.     45.5 18415  Pseudotsu… Pinac…  36.3 2019-07-20 00:00:00 PSME   
 4     -123.     45.5 18417  Pseudotsu… Pinac…  32.4 2019-07-20 00:00:00 PSME   
 5     -123.     45.5 18420  Pseudotsu… Pinac…  18.2 2019-07-20 00:00:00 PSME   
 6     -123.     45.5 18423  Thuja      Cupre…  34.4 2019-07-20 00:00:00 THPL   
 7     -123.     45.5 18486  Pseudotsu… Pinac…  38   2019-07-20 00:00:00 PSME   
 8     -123.     45.5 18488  Pseudotsu… Pinac…  31.2 2019-07-20 00:00:00 PSME   
 9     -123.     45.5 18489  Pseudotsu… Pinac…  32.2 2019-07-20 00:00:00 PSME   
10     -123.     45.5 18490  Pseudotsu… Pinac…  49.2 2019-07-20 00:00:00 PSME   
# ℹ 87 more rows
# ℹ 26 more variables: Common_Name <chr>, Condition <chr>, Tree_Height <dbl>,
#   Crown_Width_NS <dbl>, Crown_Width_EW <dbl>, Crown_Base_Height <dbl>,
#   Collected_By <chr>, Park <chr>, Scientific_Name <chr>,
#   Functional_Type <chr>, Mature_Size <fct>, Native <chr>, Edible <chr>,
#   Nuisance <chr>, Structural_Value <dbl>, Carbon_Storage_lb <dbl>,
#   Carbon_Storage_value <dbl>, Carbon_Sequestration_lb <dbl>, …

A plot

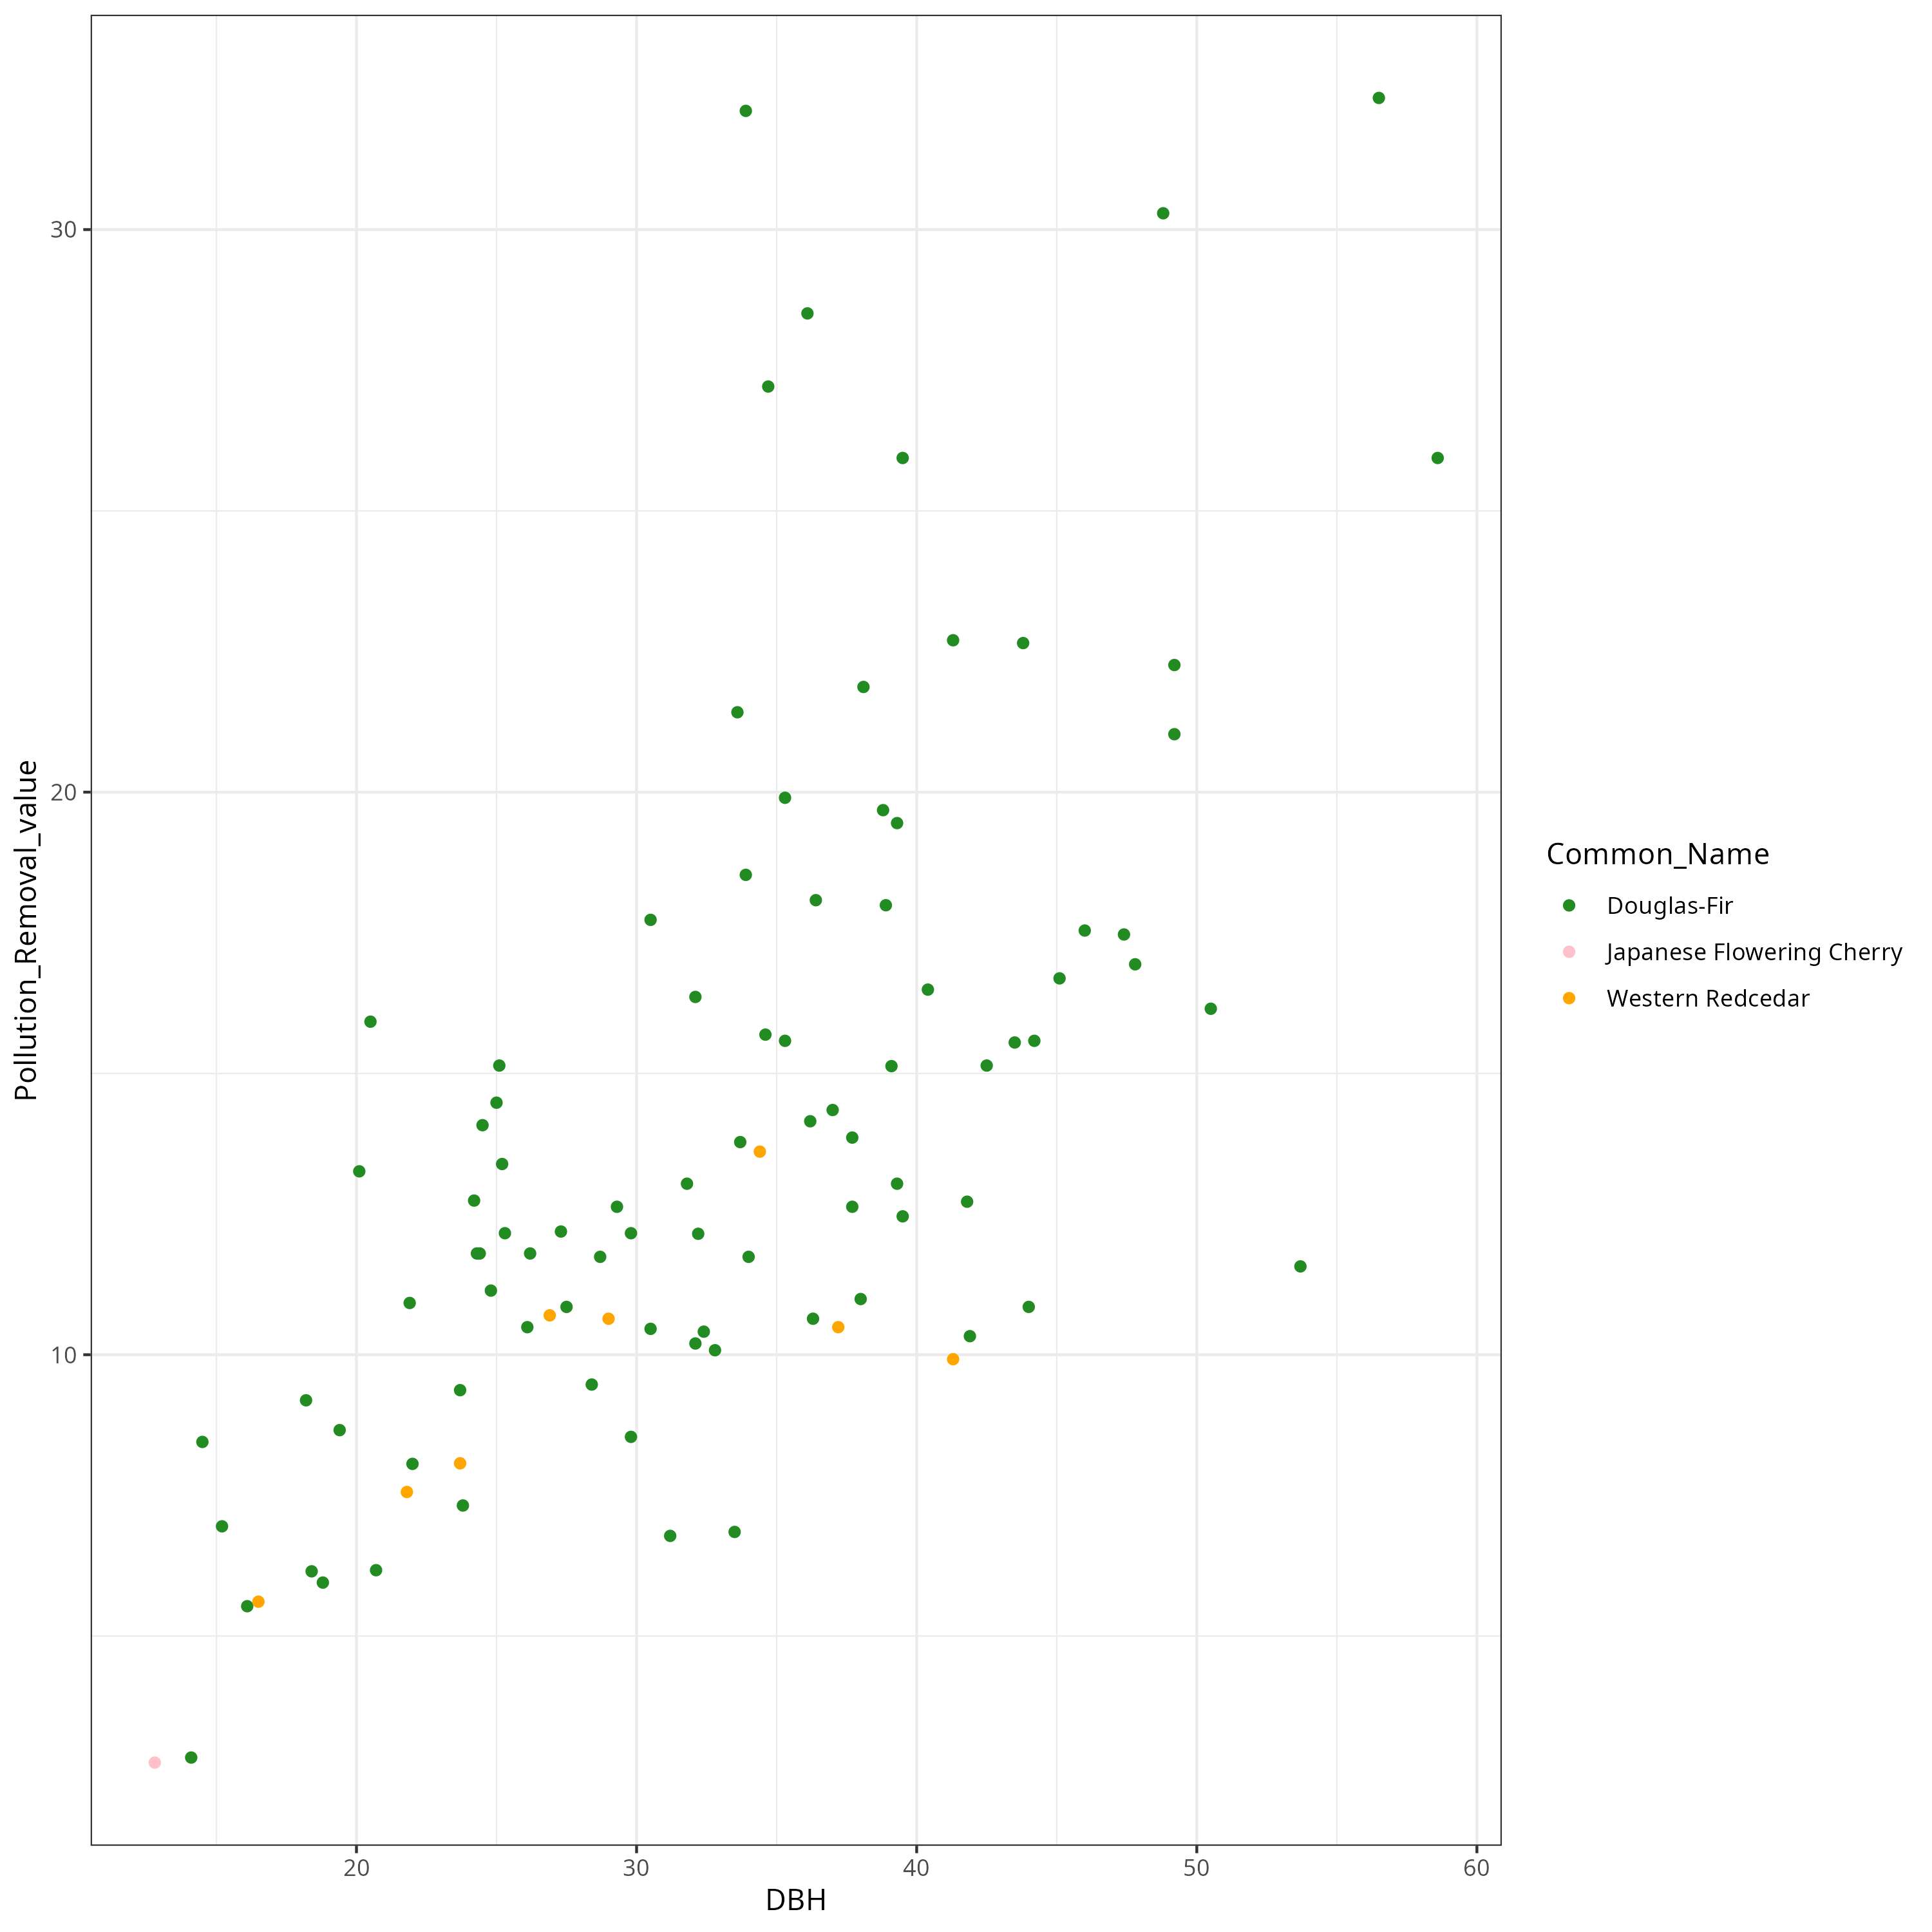
ggplot(dat, aes(x = DBH, y = Pollution_Removal_value, color = Common_Name)) + 
  geom_point()

A plot, saved

p1 <- ggplot(dat, aes(x = DBH,
                      y = Pollution_Removal_value, 
                      color = Common_Name)) + 
  geom_point()

A saved plot, plotted

p1

Plotting a saved plot, and modifying

p1 + 
  scale_color_manual(values = c("forestgreen", "pink", "orange")) +
  theme_bw() 

Saving this modification

p1 <- p1 + 
  scale_color_manual(values = c("forestgreen", "pink", "orange")) +
  theme_bw()

Plotting the saved plot

p1

Another plot

p2 <- ggplot(dat, aes(x = Common_Name, y = DBH)) + 
  geom_boxplot()

Viewing the plot

p2 

Combining: enter, patchwork

library(patchwork)
p1 + p2

Changing plot orientation

p1 / p2

Applying a theme to all plots

p1 + p2 & theme_bw()

Applying a theme to all plots

p1 + p2 & theme_dark()

Third plot

p3 <- ggplot(dat, aes(x = DBH)) + 
  geom_histogram(color = "black") + 
  theme_bw()
p3

Combining 3 plots with patchwork

p1 + p2 + p3

Combining 3 plots with patchwork

(p1 + p2) /  p3

Combining 3 plots with patchwork

(p1 + p2) /  (p3 + plot_spacer())

Collecting the guides

(p1 + p2) /  (p3 + plot_spacer()) +
  plot_layout(guides = "collect")

Collecting the guides: legend at bottom

(p1 + p2) /  (p3 + plot_spacer()) +
  plot_layout(guides = "collect") &
  theme(legend.position = "bottom")

Setting the theme across plots

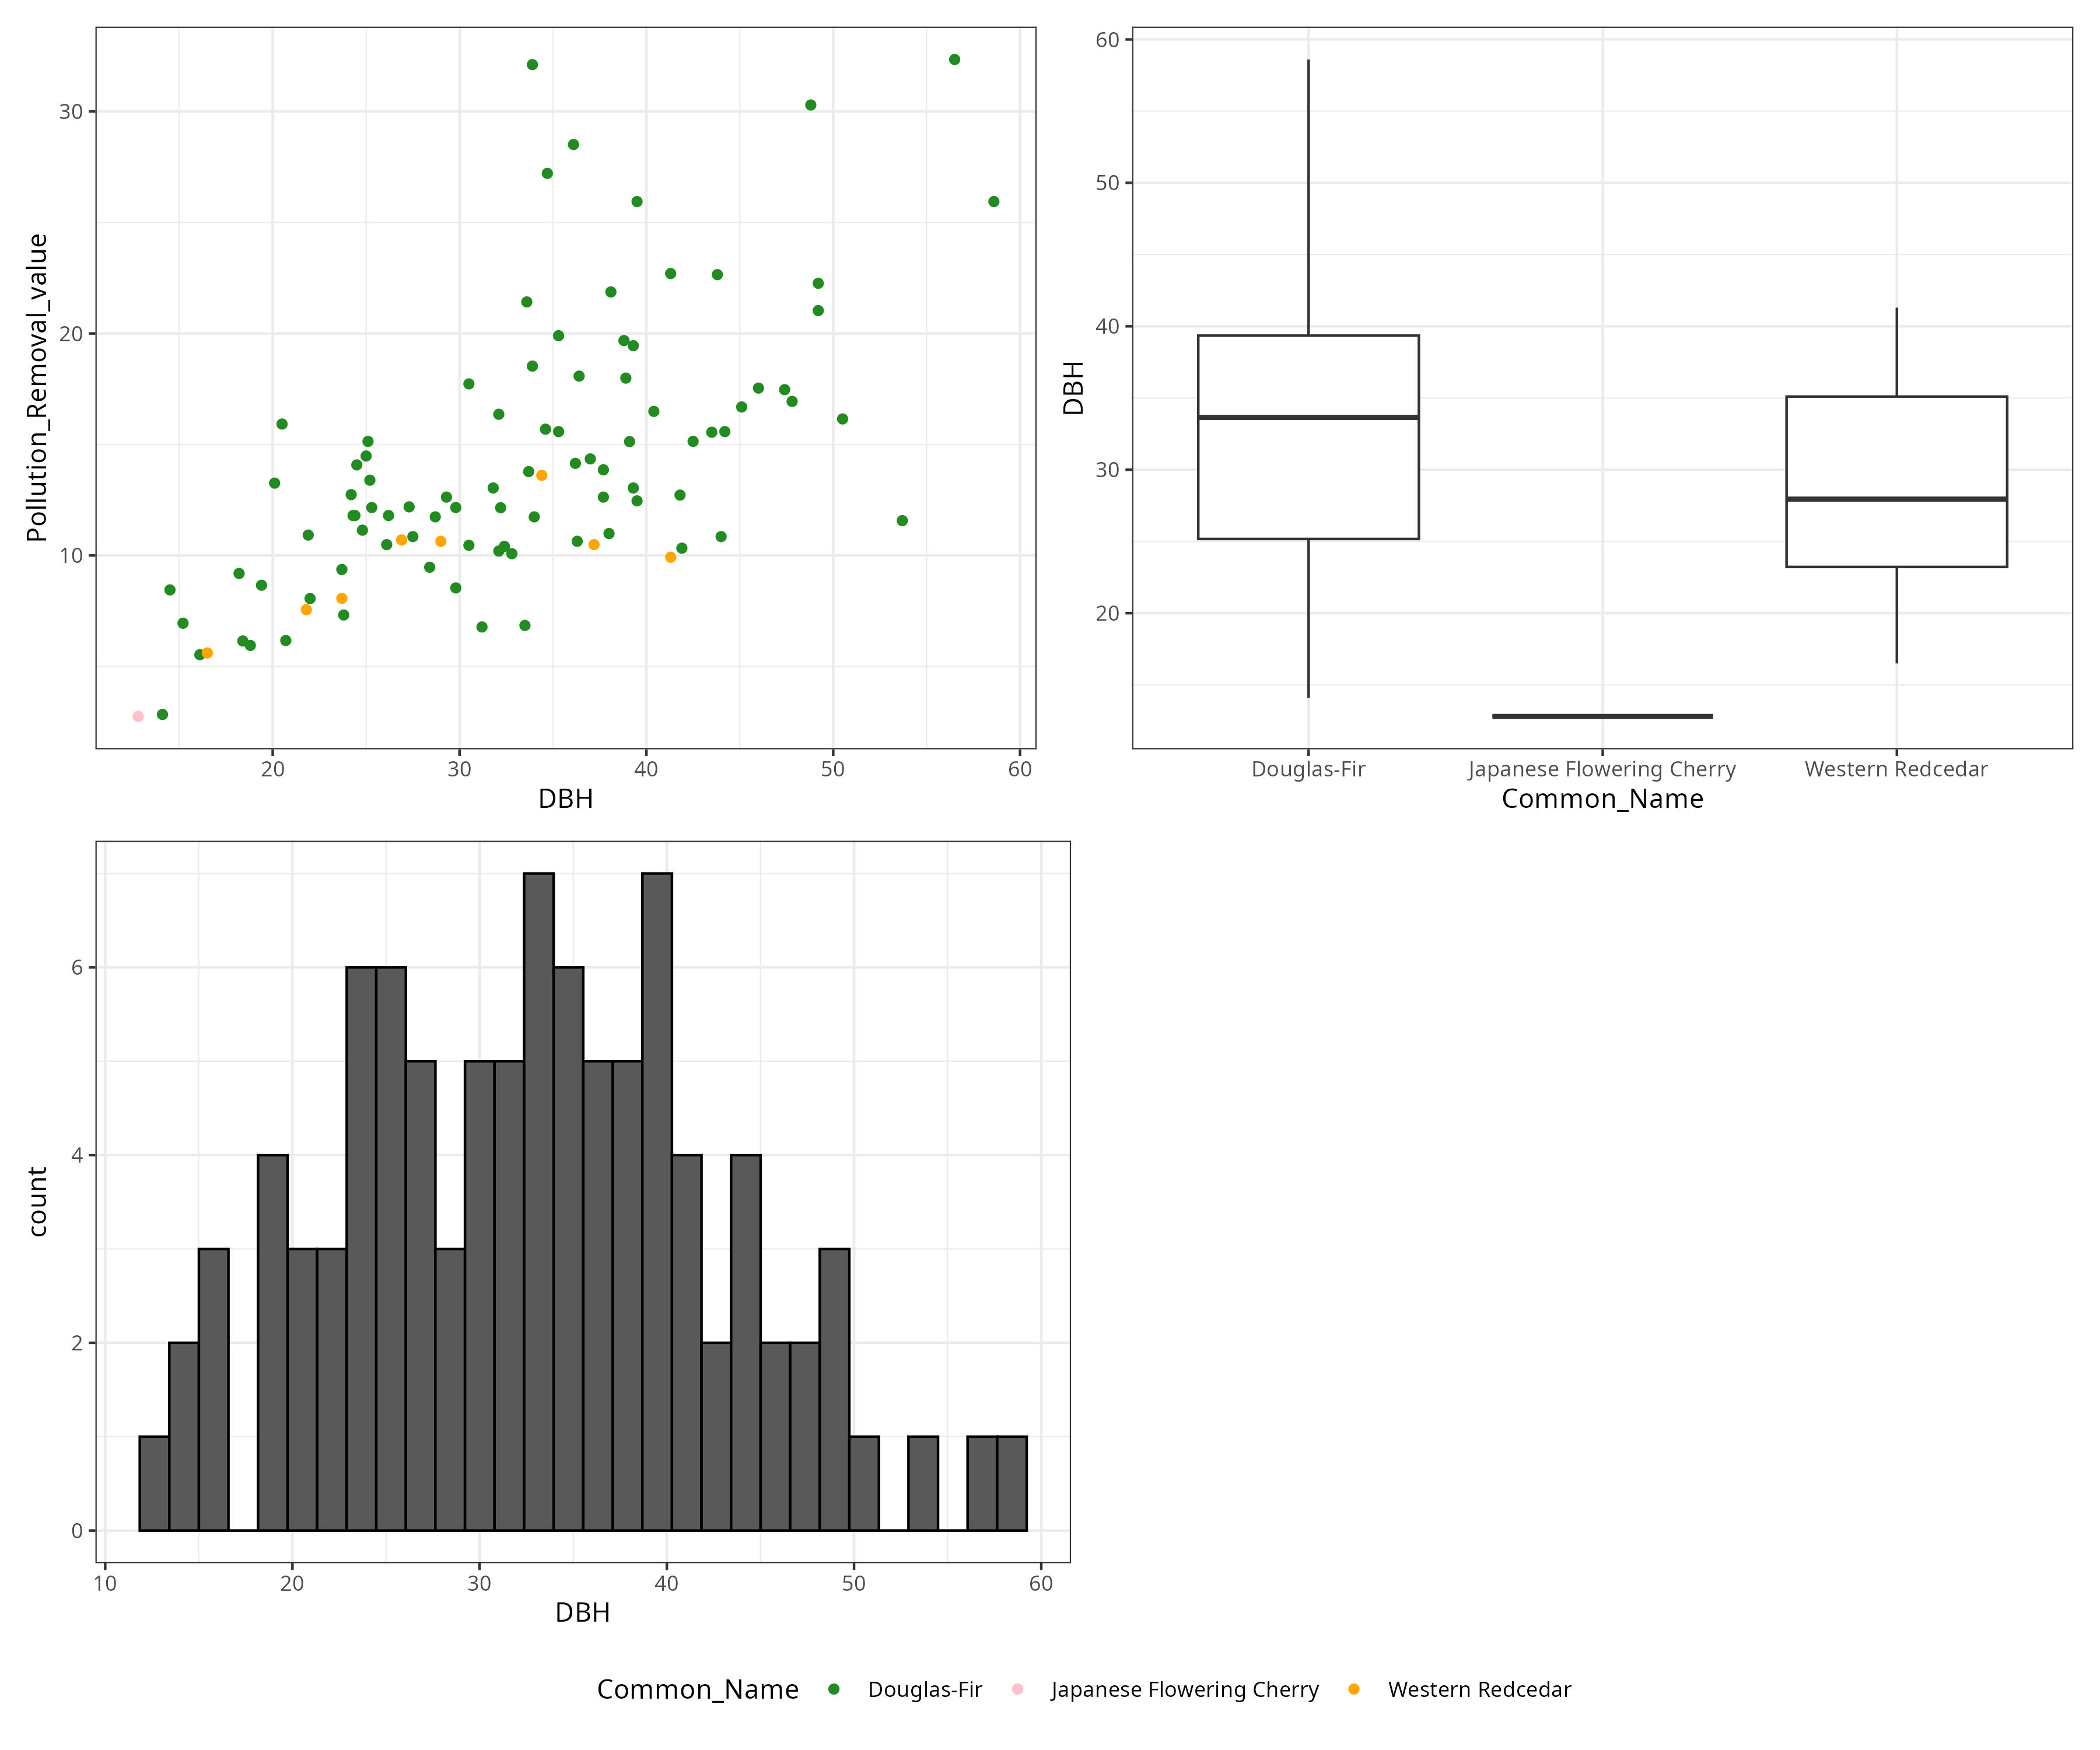
(p1 + p2) /  (p3 + plot_spacer()) +
  plot_layout(guides = "collect") &
  theme_bw() &
  theme(legend.position = "bottom")

More with patchwork

Saving graphics

Graphics are best when shared with the world. How do we get these out of R and onto our computer?

Saving graphics

Graphics are best when shared with the world. How do we get these out of R and onto our computer?

p1

Saving graphics

Graphics are best when shared with the world. How do we get these out of R and onto our computer?

list.files()
 [1] "figs"              "minard-cities.txt" "minard-troops.txt"
 [4] "Parks"             "pets.csv"          "saved_plots"      
 [7] "w10d1.html"        "w10d1.qmd"         "w10d2.html"       
[10] "w10d2.qmd"         "w11d1_files"       "w11d1.html"       
[13] "w11d1.qmd"         "w11d2_files"       "w11d2.html"       
[16] "w11d2.qmd"         "w12d1.qmd"         "w12d2_files"      
[19] "w12d2.qmd"         "w12d2.rmarkdown"   "w13d1_files"      
[22] "w13d1.html"        "w13d1.qmd"         "w14d1.html"       
[25] "w14d1.qmd"         "w15d1.html"        "w15d1.qmd"        
[28] "w1d1.html"         "w1d1.qmd"          "w1d2.html"        
[31] "w1d2.qmd"          "w2d1.html"         "w2d1.qmd"         
[34] "w2d2.qmd"          "w3d1.html"         "w3d1.qmd"         
[37] "w4d1.html"         "w4d1.qmd"          "w4d2.qmd"         
[40] "w5d1.qmd"          "w5d2.html"         "w5d2.qmd"         
[43] "w6d1.html"         "w6d1.qmd"          "w7d1.html"        
[46] "w7d1.qmd"          "w7d2.qmd"          "w8d1.html"        
[49] "w8d1.qmd"          "w8d2.html"         "w8d2.qmd"         
[52] "w9d1.html"         "w9d1.qmd"         
list.files("saved_plots")
[1] "my_patchwork.jpg" "my_plot_big.png"  "my_plot.png"     

Saving graphics

Graphics are best when shared with the world. How do we get these out of R and onto our computer?

ggsave(filename = "saved_plots/my_plot.png", plot = p1)

Saving graphics

Graphics are best when shared with the world. How do we get these out of R and onto our computer?

list.files("saved_plots")
[1] "my_patchwork.jpg" "my_plot_big.png"  "my_plot.png"     

Saving graphics: width and height

Graphics are best when shared with the world. How do we get these out of R and onto our computer?

ggsave(filename = "saved_plots/my_plot_big.png",
       plot = p1, 
       width = 10,
       height = 10, 
       units = "in")

Saving graphics: width and height

Graphics are best when shared with the world. How do we get these out of R and onto our computer?

list.files("saved_plots")
[1] "my_patchwork.jpg" "my_plot_big.png"  "my_plot.png"     

Saving graphics: a patchwork grob

Graphics are best when shared with the world. How do we get these out of R and onto our computer?

(p1 + p2) /  (p3 + plot_spacer()) +
  plot_layout(guides = "collect") &
  theme_bw() &
  theme(legend.position = "bottom")

Saving graphics: a patchwork grob

Graphics are best when shared with the world. How do we get these out of R and onto our computer?

final_plot <- (p1 + p2) /  (p3 + plot_spacer()) +
  plot_layout(guides = "collect") &
  theme_bw() &
  theme(legend.position = "bottom")

Saving graphics: a patchwork grob

Graphics are best when shared with the world. How do we get these out of R and onto our computer?

final_plot

Saving graphics: a patchwork grob

Graphics are best when shared with the world. How do we get these out of R and onto our computer?

ggsave(filename = "saved_plots/my_patchwork.jpg",
       plot = final_plot, 
       width = 12,
       height = 10, 
       units = "in")

Saving graphics: a patchwork grob

Graphics are best when shared with the world. How do we get these out of R and onto our computer?

list.files("saved_plots")
[1] "my_patchwork.jpg" "my_plot_big.png"  "my_plot.png"     

Taking a look at saved plots

knitr::include_graphics("saved_plots/my_plot.png")

Taking a look at saved plots

knitr::include_graphics("saved_plots/my_plot_big.png")

Taking a look at saved plots

knitr::include_graphics("saved_plots/my_patchwork.jpg")

Next time

  • Spatial data with sf,
  • Spatial plotting with ggplot2 + sf