More data wrangling with dplyr
Practical Computing and Data Science Tools
Announcements
- Lab 5 grades coming soon.
- Lab 6 is due this Wednesday at 5pm
- Come to office hours or schedule a meeting if you are struggling with Lab 6!
Agenda
- Quiz (15 minutes)
- More
dplyrverbs and pipes (%>%)
dplyr verbs.
Recall the standard dplyr verb form:
- The first argument of any
dplyrverb is the data (a tibble or data.frame), and the next arguments specify how we are using theverb().
And our favorite example dataset
library(tidyverse)
more_pets <- tibble(
  names = c("Dude", "Pickle", "Kyle", "Nubs", "Marvin", "Figaro", "Slim"),
  ages = c(6, 5, 3, 11, 11, 3, 6),
  meals_per_day = c(2, 3, 3, 3, 1, 2, 2),
  is_dog = c(TRUE, FALSE, FALSE, FALSE, FALSE, FALSE, TRUE)
)
more_pets
# A tibble: 7 × 4
names ages meals_per_day is_dog
<chr> <dbl> <dbl> <lgl>
1 Dude 6 2 TRUE
2 Pickle 5 3 FALSE
3 Kyle 3 3 FALSE
4 Nubs 11 3 FALSE
5 Marvin 11 1 FALSE
6 Figaro 3 2 FALSE
7 Slim 6 2 TRUE We’ll use more_pets throughout lecture today.
More verbs
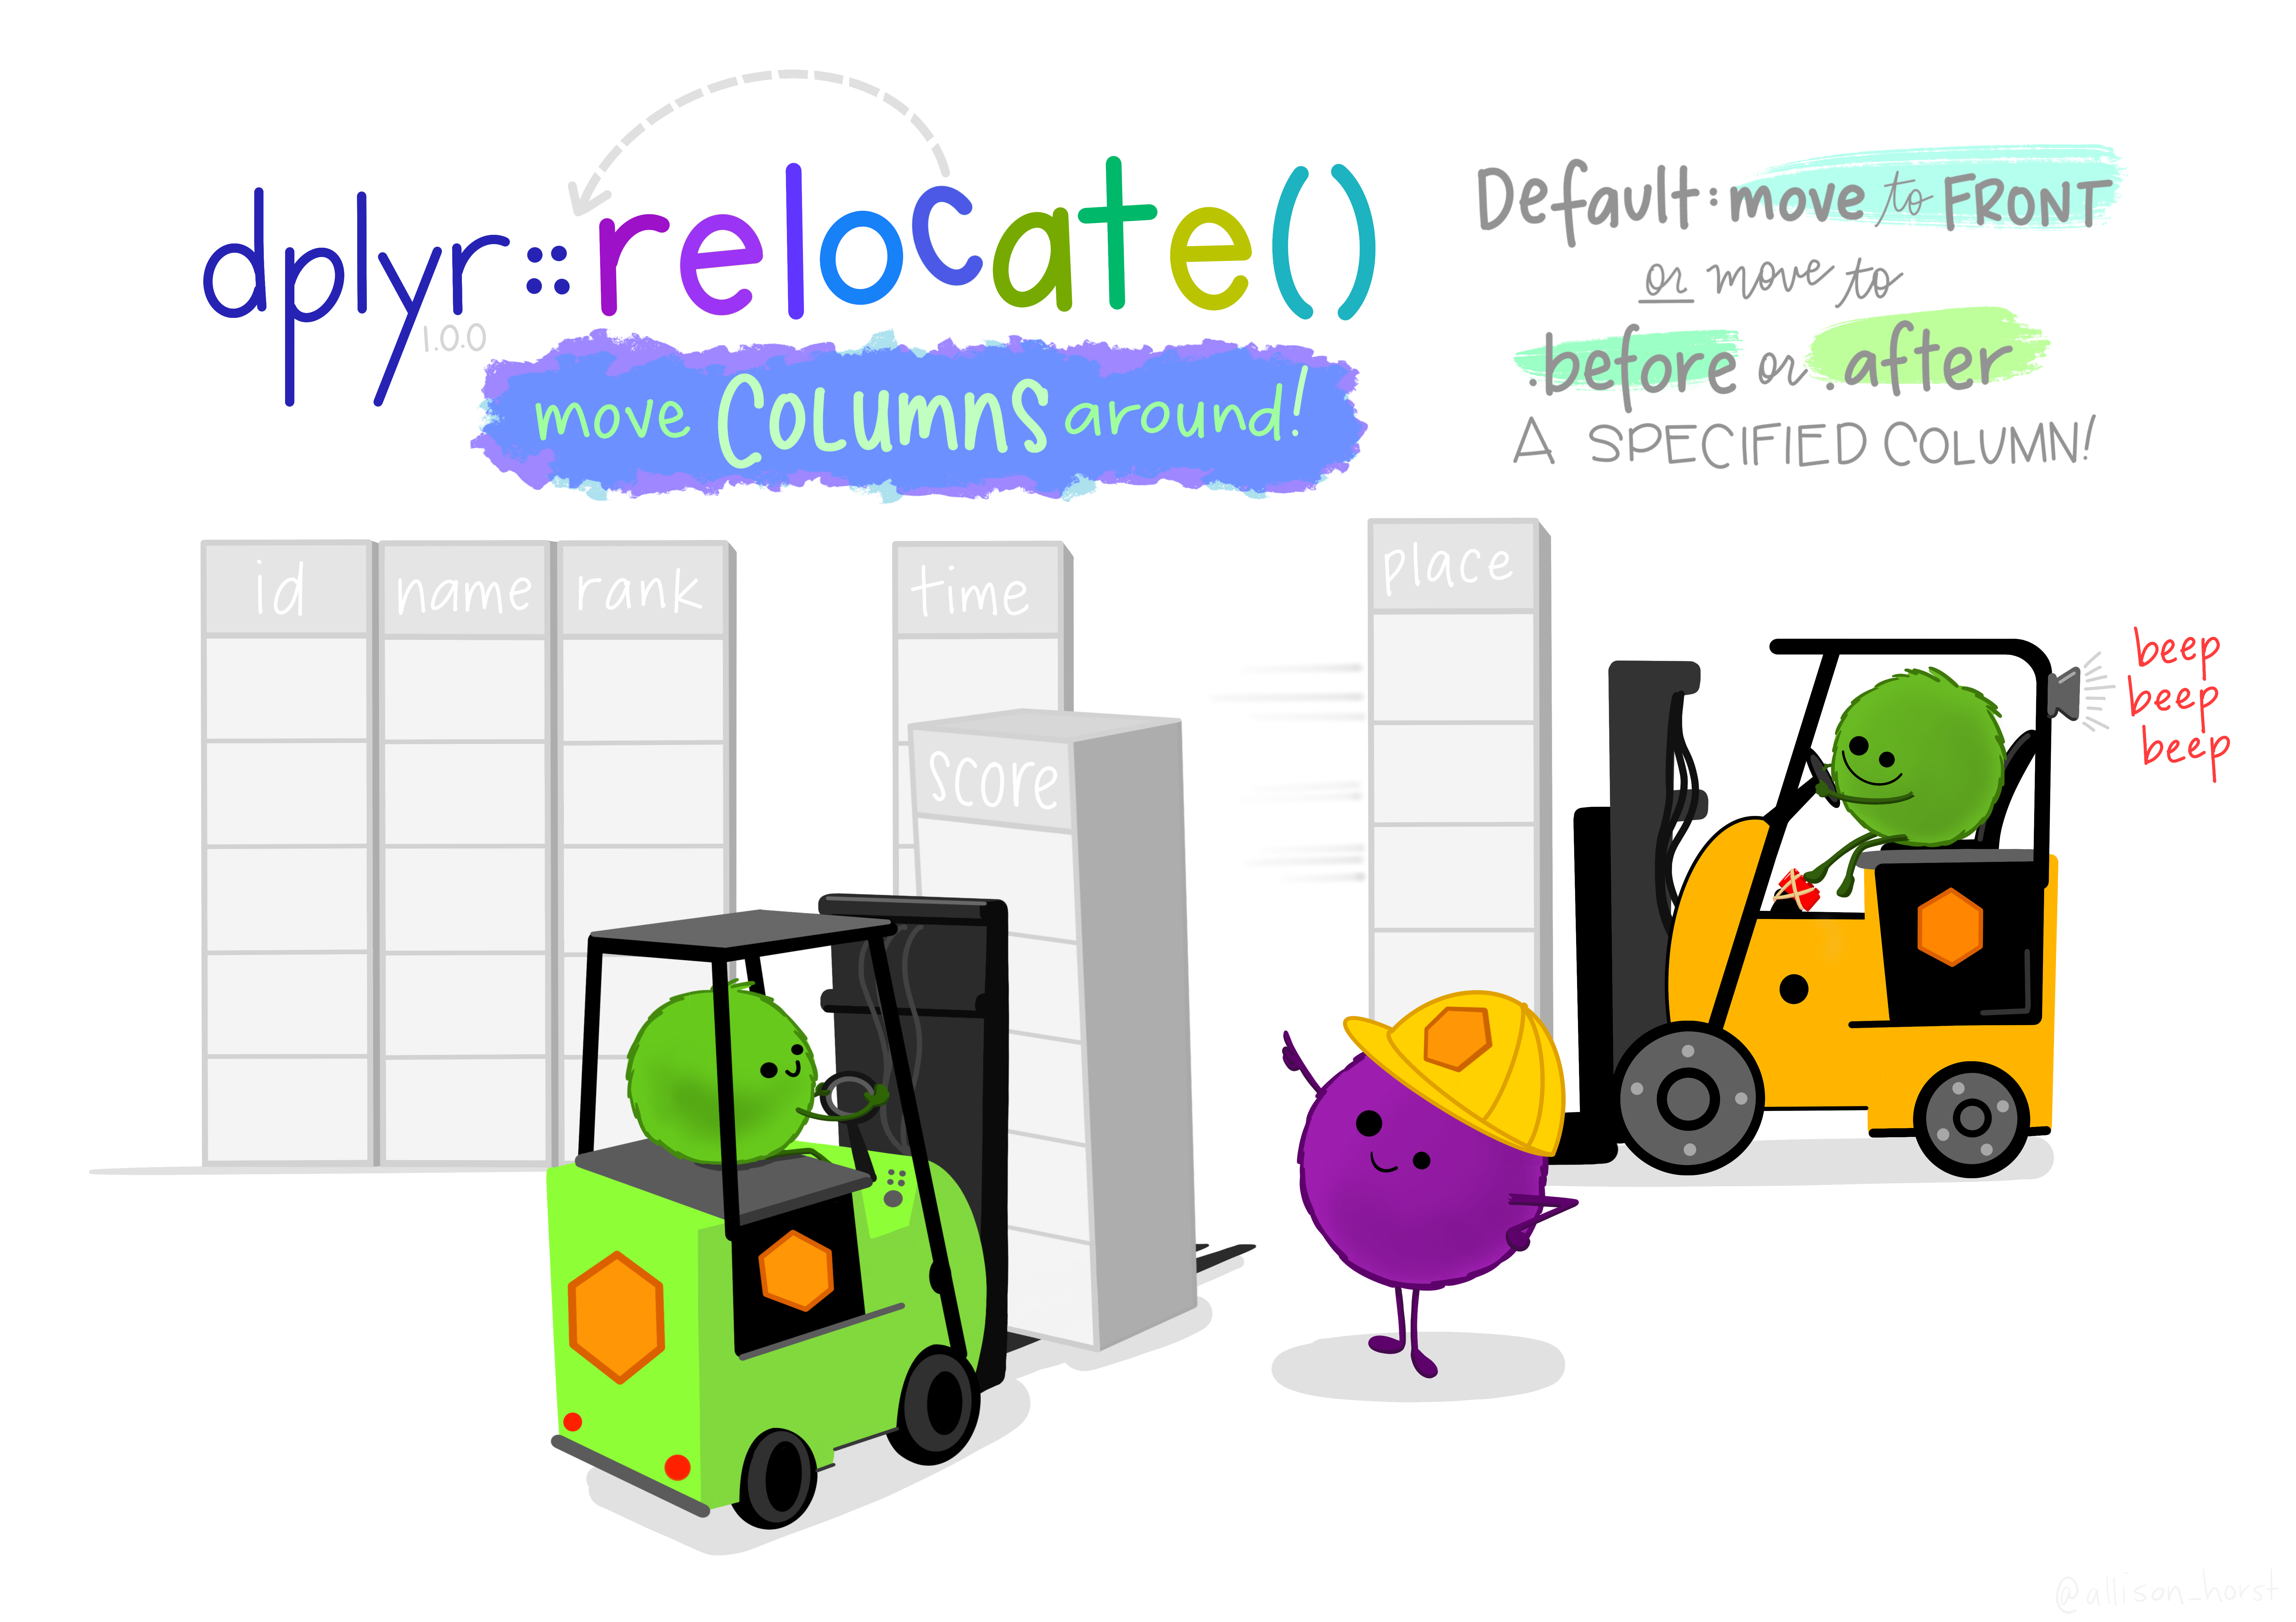
relocate()
relocate()moves columns around in a tibble
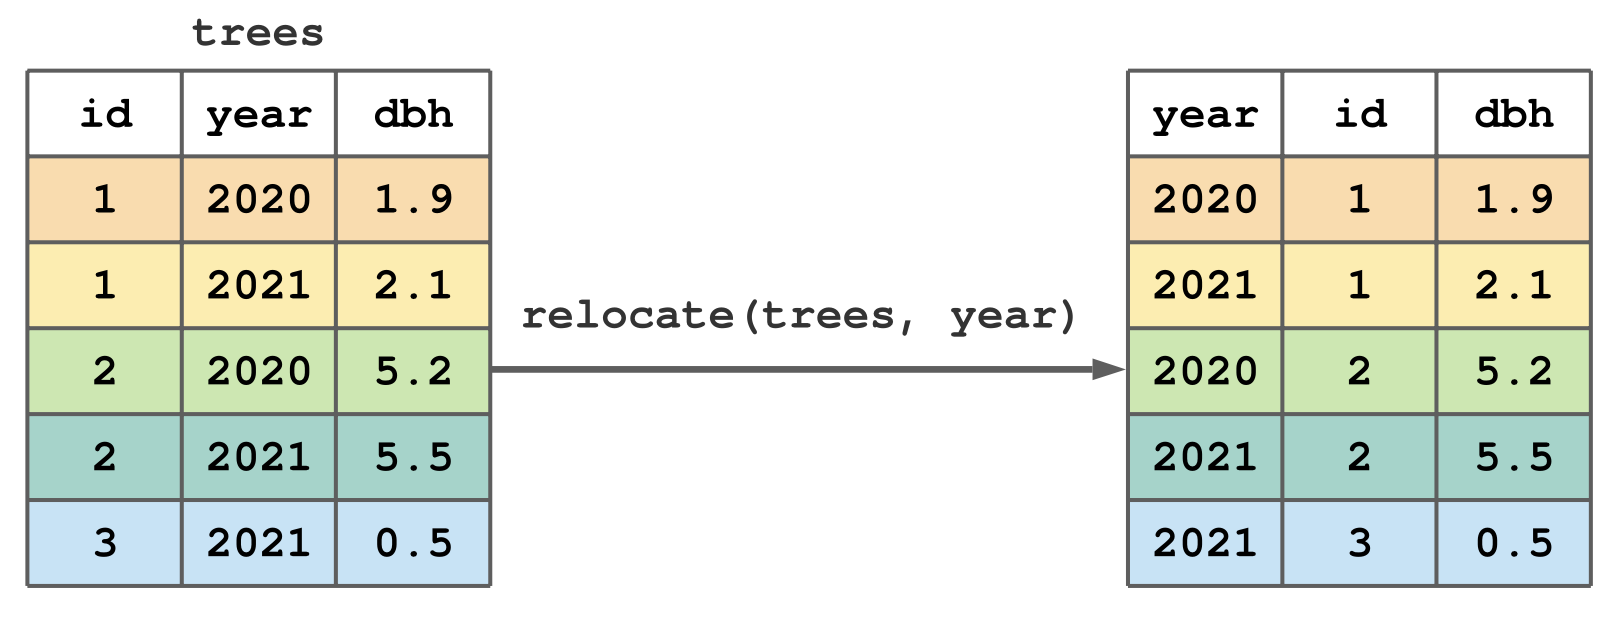
move the ages column to the front of the tibble
# A tibble: 7 × 4
   ages names  meals_per_day is_dog
  <dbl> <chr>          <dbl> <lgl>
1     6 Dude               2 TRUE
2     5 Pickle             3 FALSE
3     3 Kyle               3 FALSE
4    11 Nubs               3 FALSE
5    11 Marvin             1 FALSE
6     3 Figaro             2 FALSE
7 6 Slim 2 TRUE - Note, this is the default behavior of
relocate().
move the ages column to the end of the tibble
Hint: similar to how we removed columns with select().
move the ages column to the end of the tibble
put the names column after ages
put the names column after ages
# A tibble: 7 × 4
   ages names  meals_per_day is_dog
  <dbl> <chr>          <dbl> <lgl>
1     6 Dude               2 TRUE
2     5 Pickle             3 FALSE
3     3 Kyle               3 FALSE
4    11 Nubs               3 FALSE
5    11 Marvin             1 FALSE
6     3 Figaro             2 FALSE
7 6 Slim 2 TRUE - NOTE: this argument is called
.afternotafter
put the is_dog column before ages
put the is_dog column before ages
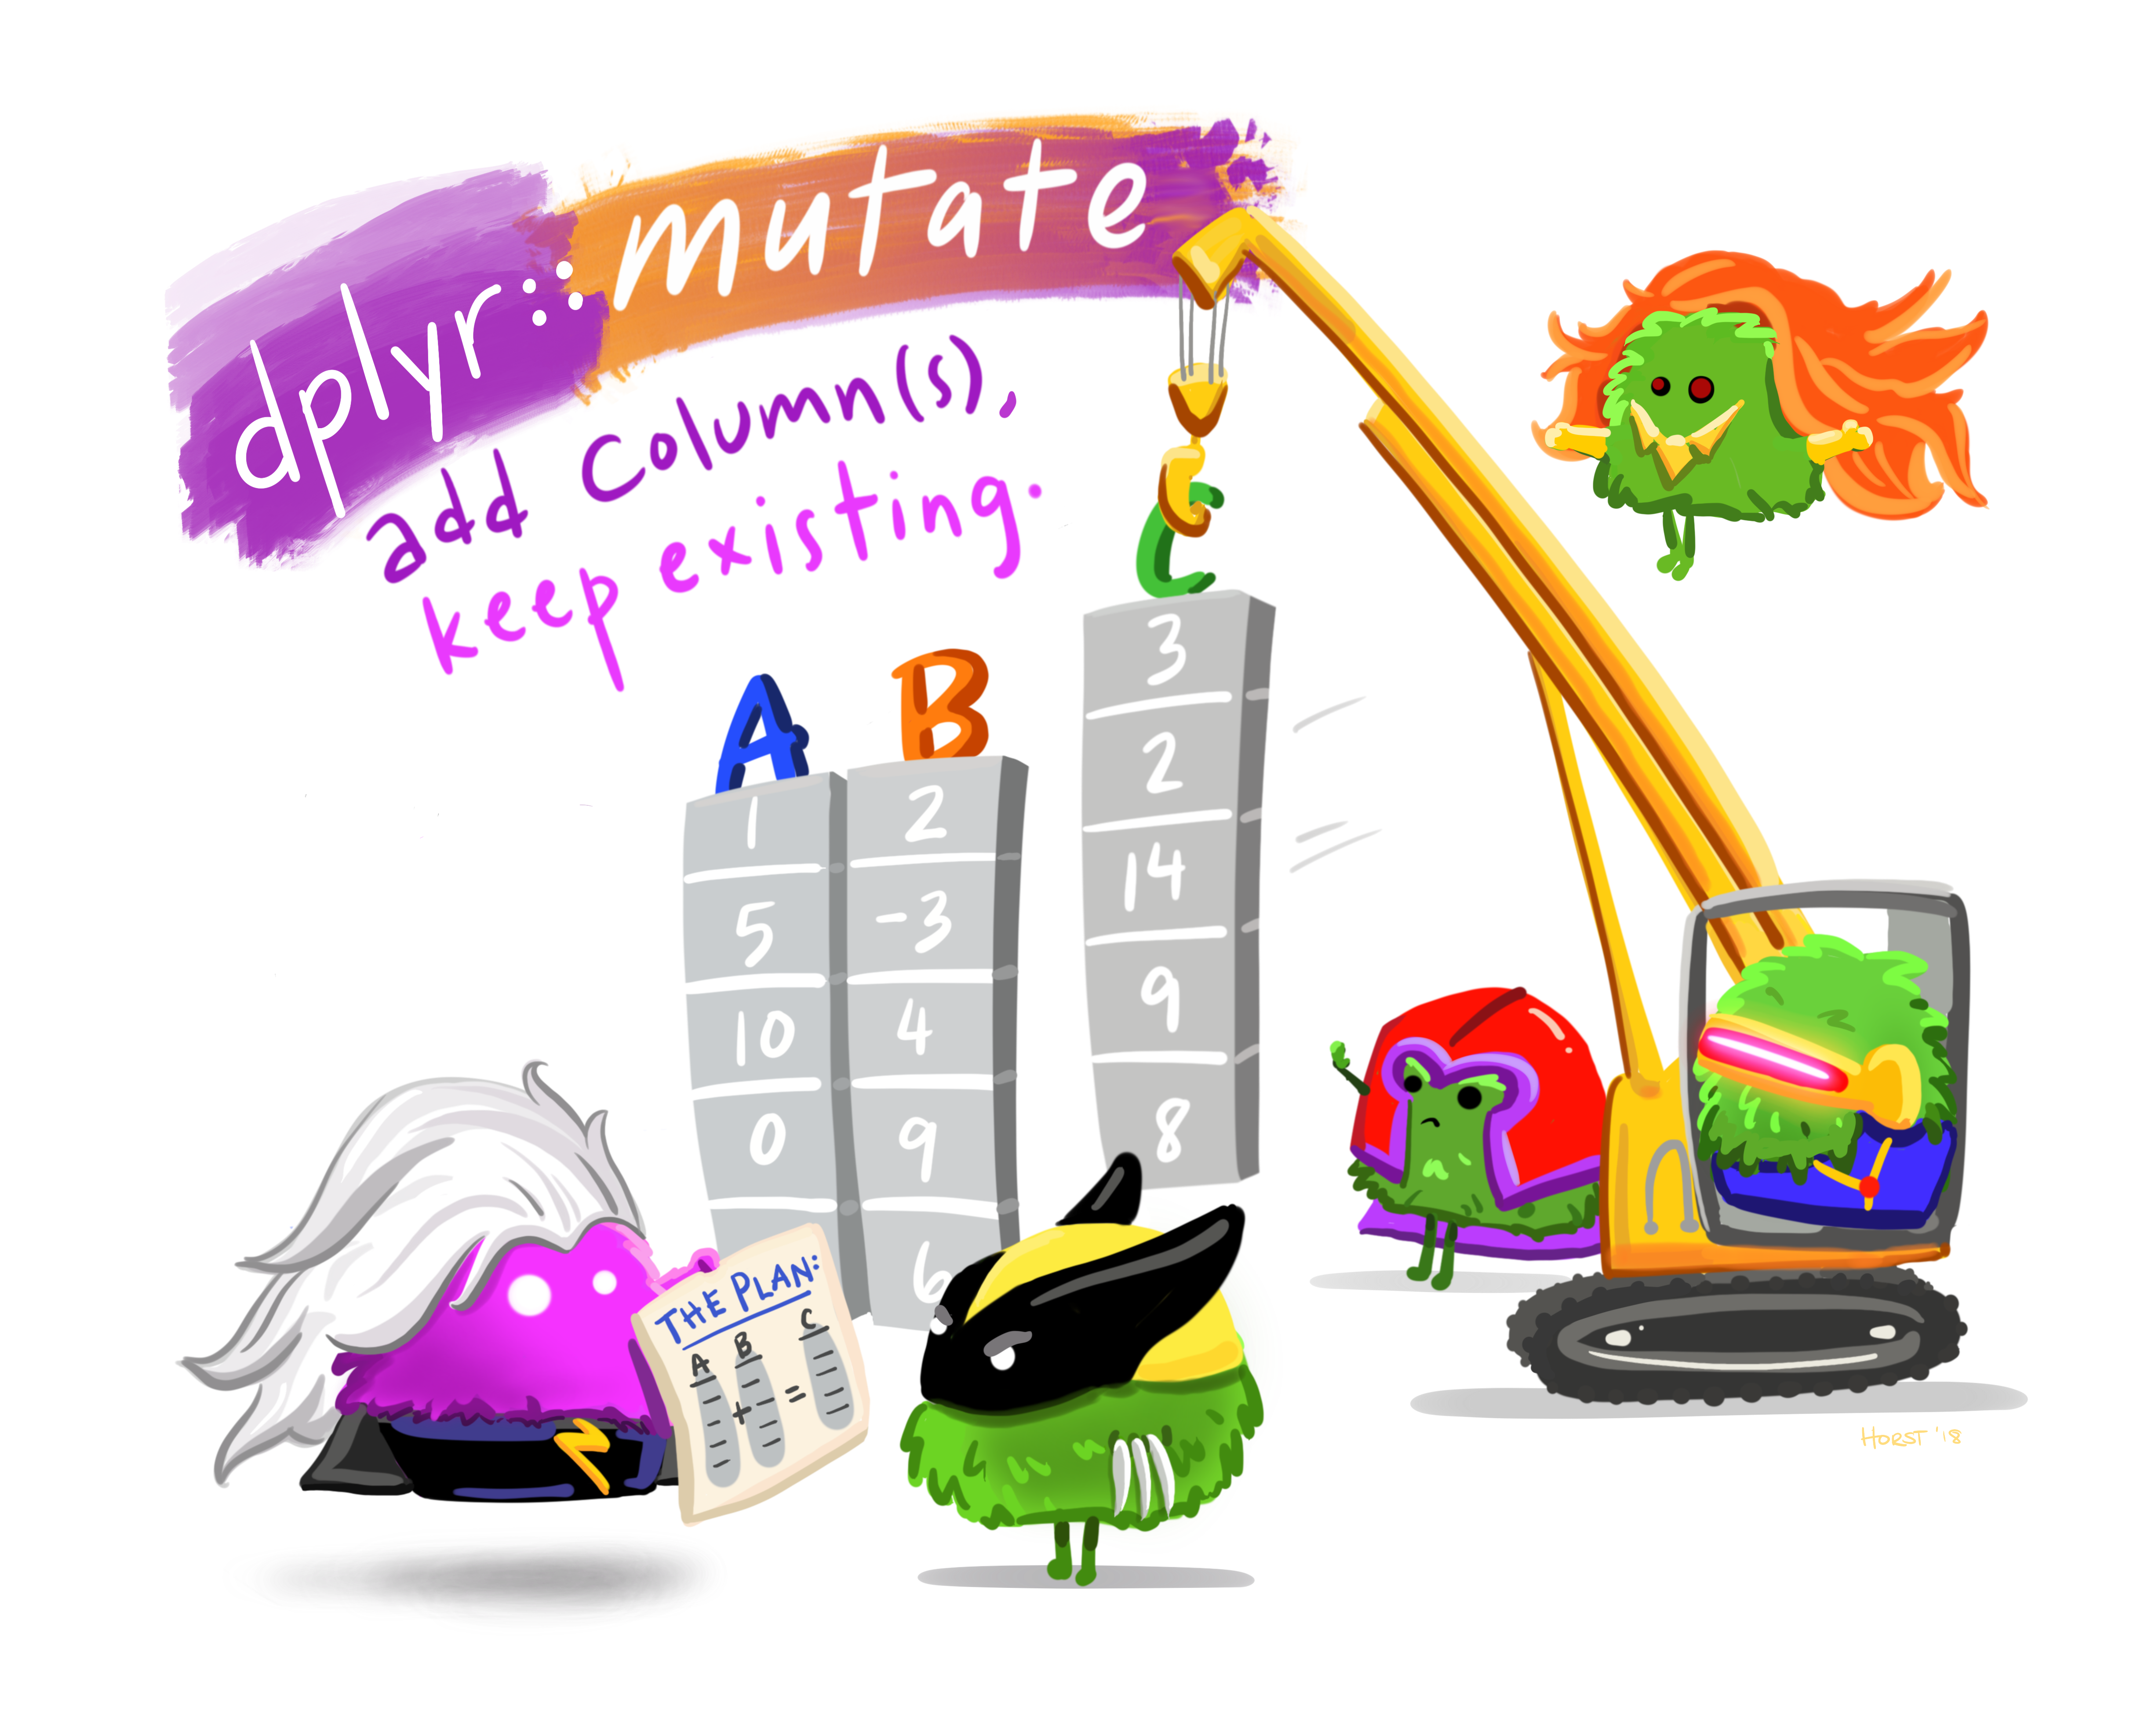
mutate()
mutate()creates new columns and adds them to the right side of an existing tibble.
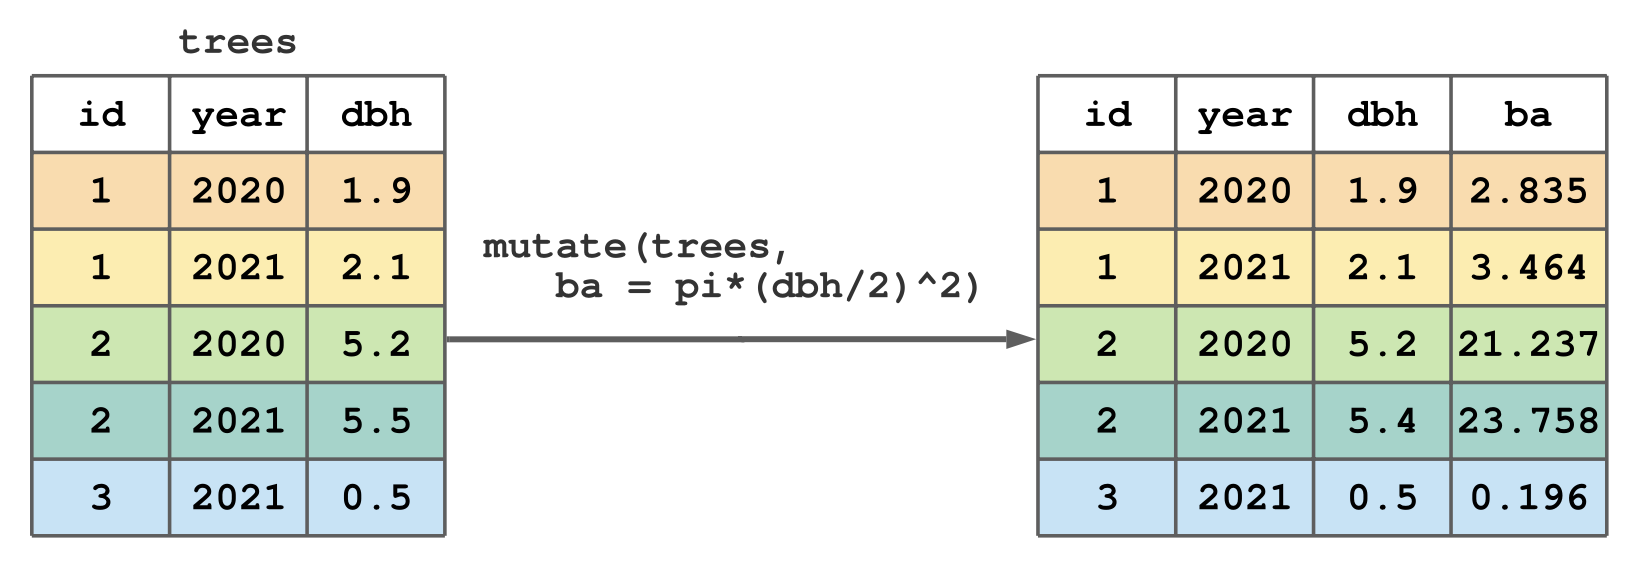
add a column called birth_year to more_pets
# A tibble: 7 × 5
  names   ages meals_per_day is_dog birth_year
  <chr>  <dbl>         <dbl> <lgl>       <dbl>
1 Dude       6             2 TRUE         2018
2 Pickle     5             3 FALSE        2019
3 Kyle       3             3 FALSE        2021
4 Nubs      11             3 FALSE        2013
5 Marvin    11             1 FALSE        2013
6 Figaro     3             2 FALSE        2021
7 Slim 6 2 TRUE 2018- Note this just prints out the new dataset.
- What would we have to do if we wanted to save this column in
more_pets?
Use the assignment operator!
more_pets <- mutate(more_pets,
                    birth_year = 2024 - ages)
# now the column is added to more_pets
more_pets
# A tibble: 7 × 5
names ages meals_per_day is_dog birth_year
<chr> <dbl> <dbl> <lgl> <dbl>
1 Dude 6 2 TRUE 2018
2 Pickle 5 3 FALSE 2019
3 Kyle 3 3 FALSE 2021
4 Nubs 11 3 FALSE 2013
5 Marvin 11 1 FALSE 2013
6 Figaro 3 2 FALSE 2021
7 Slim 6 2 TRUE 2018Add a column for meals per year
Add a column for meals per year
# A tibble: 7 × 6
names ages meals_per_day is_dog birth_year meals_per_year
<chr> <dbl> <dbl> <lgl> <dbl> <dbl>
1 Dude 6 2 TRUE 2018 730
2 Pickle 5 3 FALSE 2019 1095
3 Kyle 3 3 FALSE 2021 1095
4 Nubs 11 3 FALSE 2013 1095
5 Marvin 11 1 FALSE 2013 365
6 Figaro 3 2 FALSE 2021 730
7 Slim 6 2 TRUE 2018 730Equivalently, we can use the pipe to add this column
Equivalently, we can use the pipe to add this column
# A tibble: 7 × 6
names ages meals_per_day is_dog birth_year meals_per_year
<chr> <dbl> <dbl> <lgl> <dbl> <dbl>
1 Dude 6 2 TRUE 2018 730
2 Pickle 5 3 FALSE 2019 1095
3 Kyle 3 3 FALSE 2021 1095
4 Nubs 11 3 FALSE 2013 1095
5 Marvin 11 1 FALSE 2013 365
6 Figaro 3 2 FALSE 2021 730
7 Slim 6 2 TRUE 2018 730- The pipe (
%>%) puts the dataset before it into the first argument of the following function.
Let’s talk about the pipe

dplyr’s pipe (%>%)
- Used to string together “sentences” with
dplyrverbs. - Can be read as “and then”
dplyr’s pipe (%>%)
- Used to string together “sentences” with
dplyrverbs. - Can be read as “and then”
Example:
dplyr’s pipe (%>%)
- Used to string together “sentences” with
dplyrverbs. - Can be read as “and then”
Example:
Saving the resulting tibble: assignment operator!
We’ll use the pipe throughout the rest of the course
- As they arise, we will discuss more subtleties of the pipe (these are discussed in Section 7.12 of IFDAR)
Back to mutate()
A variation of mutate(): transmute().
- By default,
mutate()adds a column and keeps all the previous columns from the tibble. transmute()on the other hand, adds a column and removes all the columns from the tibble.- Let’s try it out!
use transmute() to add a logical column called age_dogyears to more_pets
use transmute() to add a column called age_dogyears to more_pets
use transmute() to add a column called age_dogyears to more_pets, but keep the names.
Note what happens when I move names in the function
What do you think will happen?
Note what happens when I move names in the function
What do you think will happen?
Add a column called post_pandemic that indicates whether or not a pet was born after 2020.
# A tibble: 7 × 5
  names   ages meals_per_day is_dog birth_year
  <chr>  <dbl>         <dbl> <lgl>       <dbl>
1 Dude       6             2 TRUE         2018
2 Pickle     5             3 FALSE        2019
3 Kyle       3             3 FALSE        2021
4 Nubs      11             3 FALSE        2013
5 Marvin    11             1 FALSE        2013
6 Figaro     3             2 FALSE        2021
7 Slim 6 2 TRUE 2018- How do we do this?
We need a case_when()
- The
case_when()function allows use to add a column based on logical conditions. - In general, when using a
case_when()within amutate()the form is something like this:
- where
condition_1andcondition_2are logical statements.
Add a column called post_pandemic that indicates whether or not a pet was born after 2020.
Add a column called post_pandemic that indicates whether or not a pet was born after 2020.
Add a column called post_pandemic that indicates whether or not a pet was born after 2020.
more_pets %>%
  mutate(post_pandemic = case_when(
    birth_year > 2020 ~ TRUE,
    birth_year <= 2020 ~ FALSE
    )
)# A tibble: 7 × 6
names ages meals_per_day is_dog birth_year post_pandemic
<chr> <dbl> <dbl> <lgl> <dbl> <lgl>
1 Dude 6 2 TRUE 2018 FALSE
2 Pickle 5 3 FALSE 2019 FALSE
3 Kyle 3 3 FALSE 2021 TRUE
4 Nubs 11 3 FALSE 2013 FALSE
5 Marvin 11 1 FALSE 2013 FALSE
6 Figaro 3 2 FALSE 2021 TRUE
7 Slim 6 2 TRUE 2018 FALSE Add a column called type_of_animal that tells us what type of animal each of the pets are
Add a column called type_of_animal that tells us what type of animal each of the pets are
Add a column called type_of_animal that tells us what type of animal each of the pets are
# A tibble: 7 × 6
  names   ages meals_per_day is_dog birth_year type_of_animal
  <chr>  <dbl>         <dbl> <lgl>       <dbl> <chr>
1 Dude       6             2 TRUE         2018 dog
2 Pickle     5             3 FALSE        2019 cat
3 Kyle       3             3 FALSE        2021 cat
4 Nubs      11             3 FALSE        2013 cat
5 Marvin    11             1 FALSE        2013 sheep/ram
6 Figaro     3             2 FALSE        2021 cat
7 Slim       6             2 TRUE         2018 dog
Summarizing data with dplyr
Summarization
- Data summaries are some of the best ways to learn from the data we have.
- With increasingly large data, it can be very helpful to summarize.
dplyrprovides intuitive and powerful ways to summarize data.- They call their function for summarization, suprisingly,
summarize()
Summarization
- The
summarize()function takes a very similar form to the otherdplyrfunctions. - In particular, it is of the form:
Get the mean value of the pet’s ages
Get the total years lived by the pets
It is common to want to summarize data by group.
- For example, one might want to get the average age of pets for each type of animal,
- Or, in a more forestry example, the average DBH of different tree species’ in a stand.
- We’ll do the pets one today.
group_by()
- The
group_by()function allows us to group our tibble by a variable of interest. group_by()on its own, does not change the rows or columns of the tibble, it just makes it “grouped”- However, when we go to
summarize()“grouped” data, we get the results for each group. - Let’s try it out!
average age for each type of pet
# A tibble: 7 × 6
  names   ages meals_per_day is_dog birth_year type_of_animal
  <chr>  <dbl>         <dbl> <lgl>       <dbl> <chr>
1 Dude       6             2 TRUE         2018 dog
2 Pickle     5             3 FALSE        2019 cat
3 Kyle       3             3 FALSE        2021 cat
4 Nubs      11             3 FALSE        2013 cat
5 Marvin    11             1 FALSE        2013 sheep/ram
6 Figaro     3             2 FALSE        2021 cat
7 Slim       6             2 TRUE         2018 dog
average age for each type of pet
# A tibble: 7 × 6
# Groups:   type_of_animal [3]
  names   ages meals_per_day is_dog birth_year type_of_animal
  <chr>  <dbl>         <dbl> <lgl>       <dbl> <chr>
1 Dude       6             2 TRUE         2018 dog
2 Pickle     5             3 FALSE        2019 cat
3 Kyle       3             3 FALSE        2021 cat
4 Nubs      11             3 FALSE        2013 cat
5 Marvin    11             1 FALSE        2013 sheep/ram
6 Figaro     3             2 FALSE        2021 cat
7 Slim       6             2 TRUE         2018 dog
average age for each type of pet
Next time
- More advanced
dplyr